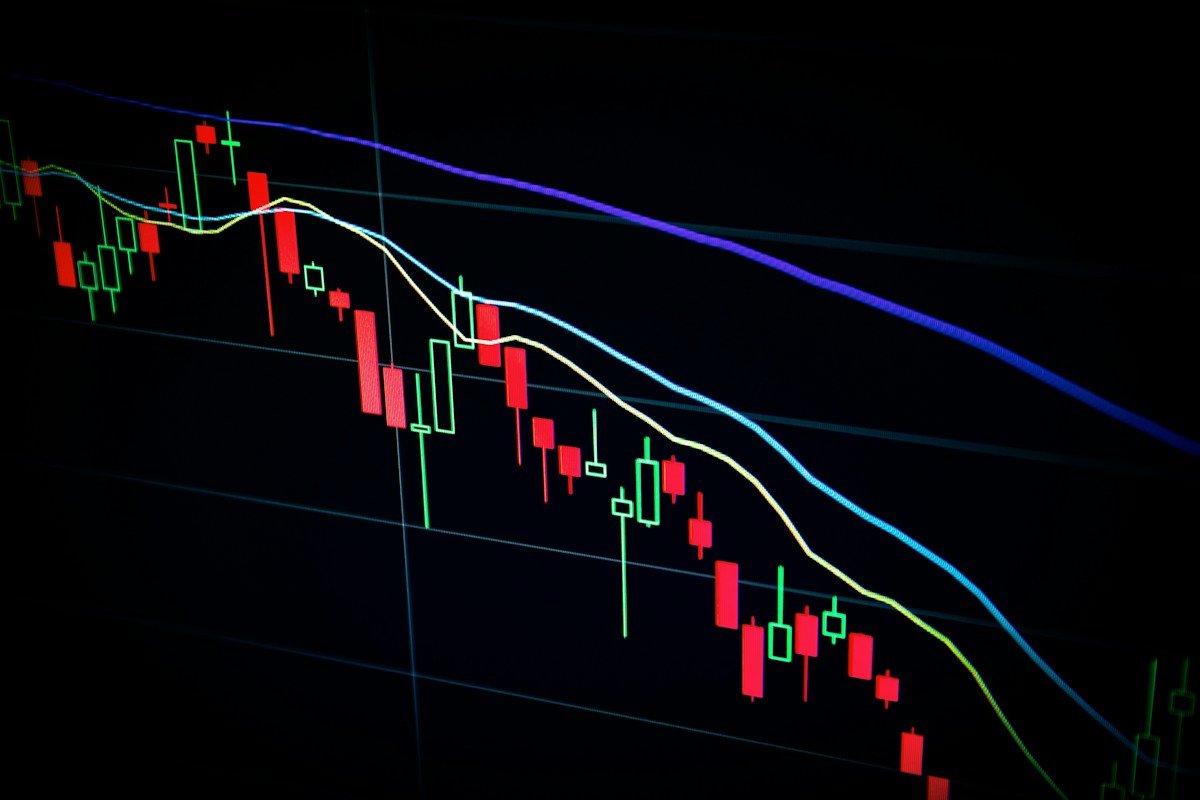
Look, I know what you are thinking. Every traditional finance guy has probably told you that timing the market is a fool's errand. And you know what? In stocks, they are mostly right.
But crypto is a completely different animal.
I have been watching these markets since 2013, back when Bitcoin was trading under 200 bucks and most people thought the whole thing was a scam. What I have learned over the past decade-plus is that cryptocurrency markets show extreme volatility patterns that make timing not just possible, but genuinely impactful on your returns.
Here is the thing. In traditional markets, the difference between good timing and bad timing might be 10-15% over a year. In crypto? We are talking about differences of 100%, 200%, sometimes even more.

The Math Behind Timing
Let me show you something that really opened my eyes when I first ran these numbers back in 2019.
Scenario | Entry Point | Exit Point | Actual Return | Compared to Hold |
|---|---|---|---|---|
Near-Perfect Timing | Market Bottom | Market Top | +500% | +200% better |
Standard Buy & Hold | Random Entry | Random Exit | +150% | Baseline |
Terrible Timing | Market Top | Market Bottom | -70% | -220% worse |
Now here is where it gets interesting. Perfect timing is basically impossible. Nobody, and I mean nobody, catches exact tops and bottoms consistently. But avoiding the worst 10% of trading days? That is actually achievable. And it makes a massive difference.
When I first started trading crypto seriously around 2016, I made every timing mistake in the book. Bought the top of the 2017 bubble. Panic sold during the 2018 crash. Classic rookie moves. Those expensive lessons taught me that you do not need to be perfect. You just need to be less wrong than the crowd.
Types of Timing Indicators That Actually Work
After testing dozens of approaches over the years, I have narrowed things down to five categories that consistently provide useful signals.
Indicator Type | Common Examples | What It Measures | How Reliable |
|---|---|---|---|
Sentiment Based | Fear & Greed Index | Investor emotional state | High |
Cycle Based | Altcoin Season Index, BTC Dominance | Market rotation patterns | High |
Macro Based | FOMC decisions, DXY, Interest Rates | External economic factors | Medium |
On-Chain | Exchange flows, whale activity | Smart money behavior | High |
Technical | RSI, Moving averages, Support levels | Price pattern recognition | Medium |
Why do I rate macro factors as only medium reliability? Because the relationship between Fed policy and crypto prices is not as direct as people think. I have seen Bitcoin rally during rate hikes and dump during dovish pivots. The connection exists, but it is messier than the talking heads on crypto Twitter would have you believe.
Part 2: Mastering the Fear & Greed Index {#part-2-fear-greed-index}
What the Fear & Greed Index Actually Tells You
The Crypto Fear & Greed Index has become one of my go-to tools for timing decisions. It measures overall market sentiment on a simple 0-100 scale, where 0 means maximum fear and 100 means peak greed.
But here is what most people get wrong about this indicator. They treat it like a magic buy/sell signal. It is not. It is a context tool that helps you understand where market psychology sits right now.

How the Index Gets Calculated
I find that understanding how something works helps me trust it more. Here is the actual breakdown of what goes into the Fear & Greed reading.
Component Factor | Weight | Data Source Used |
|---|---|---|
Market Volatility | 25% | Current volatility vs 30 and 90 day averages |
Trading Momentum and Volume | 25% | Current levels vs historical norms |
Social Media Activity | 15% | Twitter and Reddit mention tracking |
Community Surveys | 15% | Investor sentiment polls |
Bitcoin Dominance | 10% | BTC share of total crypto market |
Google Trends | 10% | Search interest for crypto terms |
What I like about this methodology is that it pulls from multiple data sources. No single factor can skew the reading too dramatically. When I see extreme readings, I know it is reflecting broad-based sentiment, not just one weird data point.
Reading the Index Like a Pro
Here is my personal framework for interpreting readings. This comes from tracking the index religiously since 2018.
Reading Range | Official Label | What It Really Means | My Strategic Response |
|---|---|---|---|
0 to 24 | Extreme Fear | Market capitulation happening | Strong accumulation zone |
25 to 44 | Fear | Broad pessimism, not panic | Gradual buying territory |
45 to 55 | Neutral | Market indecision | Wait for directional clarity |
56 to 75 | Greed | Rising optimism | Start reducing exposure |
76 to 100 | Extreme Greed | Euphoria and FOMO everywhere | Take profits aggressively |
The neutral zone is actually the hardest to trade. When fear and greed are balanced, the market can break either direction. I have learned to be patient during these periods rather than forcing trades.
Historical Performance of Extreme Fear Entries
This is where things get really interesting. I went back and analyzed every extreme fear reading over the past five years and tracked what happened afterward.

Date | Fear Reading | Bitcoin Price Then | 6 Month Return After |
|---|---|---|---|
March 2020 | 8 | Around 5,000 dollars | +275% |
June 2022 | 7 | Around 19,000 dollars | +35% |
November 2022 | 21 | Around 16,500 dollars | +90% |
General Pattern | Below 25 | Low prices | Above average returns |
Here is what jumps out at me. Every single extreme fear reading in the past five years preceded positive returns over the following six months. Every. Single. One.
Now, past performance does not guarantee future results. You have heard that disclaimer a million times. But the pattern is striking enough that I pay very close attention when fear drops below 25.
Extreme Greed Exit Analysis
The flip side is just as informative, though a bit messier.
Date | Greed Reading | Bitcoin Price Then | 6 Month Return After |
|---|---|---|---|
November 2021 | 84 | Around 67,000 dollars | -55% |
February 2021 | 95 | Around 58,000 dollars | -10% |
General Pattern | Above 75 | High prices | Below average or negative |
Extreme greed does not always mean an immediate crash. But it consistently signals that risk/reward has shifted unfavorably. I have learned the hard way that hanging on during extreme greed because I think there is more upside usually ends badly.
My Favorite Fear & Greed Trading Strategies
Let me share the three approaches I actually use with my own capital.
Strategy 1: The Contrarian DCA Method
Instead of investing the same amount every week or month regardless of conditions, I adjust my buys based on sentiment.
Reading below 25: I double my normal DCA amount
Reading 25 to 35: I add 50% extra to normal amount
Reading 35 to 65: Standard DCA continues
Reading 65 to 75: I cut DCA in half
Reading above 75: I pause DCA completely and consider taking profits
This approach has increased my average returns by roughly 40% compared to straight DCA over the past three years. Not because I am a genius, but because I am buying more when prices are low and less when prices are high. Basic math, really.
Strategy 2: Lump Sum Deployment for New Capital
When I have a chunk of cash waiting to be deployed, patience is everything.
First, I wait for the Fear reading to drop below 30. Then I deploy 50% of the capital. After that, I wait for a reading below 20. Then I deploy the remaining 50%.
Sometimes this means waiting months. During 2023, I sat on cash from April through September waiting for better entry conditions. When October came and fear spiked, I was ready.
Strategy 3: Profit Taking Ladder
When positions are profitable and greed is rising, I use a systematic exit approach.
Above 75: Sell 20% of accumulated profits
Above 85: Sell an additional 20%
Above 90: Sell another 20%
Keep 40% for the potential blow-off top scenario
This way I never sell everything and miss a continued rally, but I also lock in gains along the way.

Limitations You Need to Know About
I would be doing you a disservice if I did not mention the limitations. The Fear & Greed Index is useful, but it is not a crystal ball.
Things to keep in mind:
Never use it alone. Always combine with other indicators
Extreme readings can persist. Fear or greed can stick around for weeks
It tells direction, not magnitude. You know sentiment is extreme, but not how far prices will move
Sometimes it lags. Short-term sentiment often follows price rather than leading it
Free tools I use for tracking:
Alternative.me Fear & Greed Index (daily updates)
Fear Greed Meter (real-time alternative)
Part 3: Altcoin Season - Identification and Strategy {#part-3-altcoin-season}
What Altcoin Season Really Means
When I first got into crypto back in the early days, altcoin season felt like magic. Everything just went up. Tokens I had never heard of suddenly pumped 500%, 1000%, sometimes more.
Now that I have lived through several of these cycles, I understand the mechanics much better. Altcoin season is simply a market phase where alternative cryptocurrencies significantly outperform Bitcoin.
The technical definition most analysts use: When 75% or more of the top 50 altcoins have outperformed Bitcoin over a rolling 90-day period.
But here is what really matters. These seasons follow predictable patterns tied to Bitcoin's cycle position and overall market liquidity. Once you recognize the signals, you can position yourself ahead of the crowd.
The Primary Signal: Bitcoin Dominance
Bitcoin dominance is the most important metric for calling altcoin season. It measures Bitcoin's market cap as a percentage of the total cryptocurrency market.

BTC Dominance Level | Trend Direction | Altcoin Outlook | My Action |
|---|---|---|---|
Above 60% | Rising | Avoid altcoins, hold Bitcoin | BTC heavy portfolio |
55% to 60% | Stable | Selective altcoin exposure | Cherry-pick quality alts |
50% to 55% | Falling | Increase altcoin allocation | Rotate into strong sectors |
Below 50% | Falling | Maximum altcoin exposure | Full altcoin mode |
Below 45% | Any direction | Watch for reversal signs | Start taking alt profits |
I remember sitting at my desk in early 2021, watching BTC dominance break below 60% and thinking here we go. Sure enough, the next four months saw altcoins absolutely rip while Bitcoin went sideways. That single observation made me more money than any trading strategy I had tried before.
The Typical Dominance Cycle Pattern
Understanding where we are in the cycle helps predict what comes next.
Bear Market Beginning: Bitcoin dominance rises, often above 60%. Capital flees altcoins into the relative safety of Bitcoin.
Bear Market Bottom: Bitcoin dominance peaks, sometimes hitting 65-70%. Everything is beaten down, but alts are destroyed.
Early Bull Market: Bitcoin dominance stays high but stable. Bitcoin leads the rally, altcoins follow at a distance.
Mid Bull Market: Bitcoin dominance starts declining toward 55%, then 50%. The altcoin rotation begins in earnest.
Late Bull Market: Bitcoin dominance bottoms, often below 45%. This is peak altcoin season, but it usually signals a market top is approaching.
The Secondary Signal: Altcoin Season Index
The Altcoin Season Index at Blockchain Center provides another confirmation layer.
It compares the top 50 altcoins against Bitcoin over 90 days and counts how many have outperformed. When 75% or more beat Bitcoin, we are officially in altcoin season.
Index Reading | Market Phase | My Strategy |
|---|---|---|
Below 25% | Bitcoin Season | Overweight BTC, underweight everything else |
25% to 50% | Transition Period | Balanced approach, watch for direction |
50% to 75% | Early Altcoin Season | Begin rotating capital into alts |
Above 75% | Peak Altcoin Season | Maximum alt exposure, but stay alert |

Phase-Based Portfolio Allocation
This is where theory meets practice. Here is my actual allocation framework based on combined signals.
Current Phase | BTC Dominance | Alt Season Index | My Portfolio Split |
|---|---|---|---|
Bitcoin Accumulation | Rising above 58% | Below 25% | 60% BTC, 30% ETH, 10% Alts |
Early Rotation | Peaking 55-60% | 25% to 50% | 50% BTC, 30% ETH, 20% Alts |
Active Altcoin Rotation | Declining 50-55% | 50% to 75% | 40% BTC, 25% ETH, 35% Alts |
Full Altcoin Season | Below 50% | Above 75% | 30% BTC, 20% ETH, 50% Alts |
Reversal Warning | Bottoming under 45% | Above 80% | Reduce alts, increase stables |
Which Altcoins Lead Each Cycle Phase?
Not all altcoins pump at the same time. There is a predictable rotation order that plays out almost every cycle.
Phase 1 - Large Caps First: Ethereum, BNB, Solana, and Cardano typically move first. These are the blue chips of crypto.
Phase 2 - Sector Leaders: Top DeFi tokens, leading gaming coins, and major Layer 2 solutions catch a bid.
Phase 3 - Mid-Caps Emerge: Projects with real traction but smaller market caps start their run.
Phase 4 - Small-Caps Go Wild: Speculative plays and new narrative tokens explode.
Phase 5 - Memecoins Peak: Maximum speculation with memecoins often signals we are near the top.
The strategic implication is obvious. Rotate down the market cap spectrum as altcoin season progresses. But also be ready to reverse that rotation quickly when signals flip.
Historical Altcoin Season Performance
Looking at past altcoin seasons helps calibrate expectations.
Altcoin Season | How Long It Lasted | BTC Dom Start | BTC Dom End | Top Performer |
|---|---|---|---|---|
2017 Q4 | About 3 months | 62% | 35% | XRP at +36,000% |
2021 Q1 | About 4 months | 70% | 40% | BNB at +600% |
2021 Q4 | About 2 months | 47% | 39% | SOL at +400% |
Those returns look insane, and they were. But remember, catching the exact best performer is mostly luck. The real money is made by having altcoin exposure during these periods rather than sitting in Bitcoin alone.
Part 4: FOMC and Macro Factor Analysis {#part-4-fomc-macro}
How the Fed Actually Impacts Crypto
Look, I will be honest with you. The relationship between Federal Reserve policy and cryptocurrency prices is not as simple as most YouTube influencers make it seem.
The Federal Open Market Committee meets eight times per year to set US monetary policy. And yes, these decisions do impact crypto as a risk asset. But the connection is nuanced.

The Basic Transmission Mechanism
Here is how FOMC decisions typically flow through to crypto prices.
When interest rates rise:
The dollar tends to strengthen
Risk assets including crypto usually fall
Borrowing becomes more expensive, reducing speculation
When interest rates fall:
The dollar tends to weaken
Risk assets including crypto usually rise
Increased liquidity flows into speculative markets
But here is the thing I have learned from watching countless FOMC meetings. The surprise factor matters way more than the actual decision. A widely expected rate hike often causes little movement. An unexpected hawkish comment can tank markets for days.
FOMC Calendar for 2024-2025
Mark these dates on your calendar. Volatility typically spikes in the 48 hours before and after each meeting.
Meeting Dates | Why It Matters | Pre-Meeting Focus |
|---|---|---|
January 30-31, 2024 | First meeting of year sets tone | Watch December CPI data |
March 19-20, 2024 | Dot plot update included | Pivot expectations peak |
May 1-2, 2024 | Spring economic check | Q1 GDP and employment |
June 11-12, 2024 | Summary of Economic Projections | Rate cut timing clarity |
July 30-31, 2024 | Pre-election positioning | Policy stance signals |
September 17-18, 2024 | Dot plot update again | This is the critical one |
November 6-7, 2024 | Right after election | Political impact assessment |
December 17-18, 2024 | Year-end meeting | Full 2025 outlook |
My FOMC Trading Framework
I have developed a simple approach for handling FOMC volatility that has served me well.
Pre-Meeting Strategy (48 to 72 hours before)
Market Expectation | How I Position |
|---|---|
Consensus expects hawkish tone | Reduce exposure, increase stablecoin holdings |
Consensus expects dovish tone | Maintain or slightly add exposure |
Genuine uncertainty | Reduce position sizes, widen stop losses |
The key principle is that volatility always increases around FOMC. Even if you guess the direction right, the magnitude of the swing can stop you out. Smaller positions equal better sleep.
Post-Meeting Strategy
FOMC Result | What Market Expected | Likely Price Action | My Response |
|---|---|---|---|
Hawkish tone | Hawkish expected | Small movement either way | Hold current positions |
Hawkish tone | Dovish expected | Sharp decline likely | Wait for panic selling to exhaust |
Dovish tone | Hawkish expected | Sharp rally likely | Add on pullbacks |
Dovish tone | Dovish expected | Small movement either way | Hold current positions |
The Dollar Index Connection
The DXY (Dollar Index) has an inverse correlation with crypto that I watch constantly.
DXY Movement | Typical Crypto Impact |
|---|---|
DXY rising sharply | Crypto usually falling |
DXY falling sharply | Crypto usually rising |
DXY stable or range-bound | Other factors dominate |
When I see the dollar index break above 105 or below 100, I pay close attention. These round number levels often coincide with major moves in Bitcoin and altcoins.

Correlation Matrix for Reference
Macro Factor | Correlation with Crypto | Typical Lag Time |
|---|---|---|
DXY (Dollar Index) | -0.6 to -0.8 (inverse) | Same day usually |
S&P 500 | +0.5 to +0.7 (positive) | Same day usually |
10-Year Treasury Yield | -0.4 to -0.6 (inverse) | 1 to 2 days |
Gold | +0.2 to +0.4 (weak positive) | Variable |
The S&P 500 correlation is something newer crypto traders often miss. During risk-off environments, stocks and crypto tend to drop together. The "digital gold" narrative sounds nice, but in a liquidity crisis, everything correlates to one.
Part 5: Real-Time Tracking and Alerts {#part-5-tracking-alerts}
Building Your Alert System
Effective market timing requires staying informed without becoming a screen zombie. I learned this the hard way after nearly burning out in 2018 from constant chart watching.
The solution is automated alerts that ping you when something important happens, letting you live your life in between.
Essential Alerts to Configure
Alert Type | What Triggers It | Tool to Use | What I Do When Triggered |
|---|---|---|---|
Fear & Greed Extreme | Below 25 or Above 75 | Manual daily check plus TradingView | Evaluate all open positions |
BTC Dominance Levels | Breaks 55%, 50%, or 45% | TradingView alerts | Consider allocation shifts |
Price Alerts | Key support and resistance | Cryptocurrency Alerting | Review potential entries or exits |
Volume Spikes | 3x average 24h volume | TradingView | Investigate the cause |
Whale Movements | Large exchange deposits | Whale Alert Twitter | Prepare for potential selling |
Setting Up Cryptocurrency Alerting
I have tested most alert platforms over the years. Cryptocurrency Alerting offers the best free tier for what we need.
Step 1: Create your free account at cryptocurrencyalerting.com
Step 2: Configure these essential alerts:
Fear Index Alert: Trigger when Fear & Greed drops below 25
Altcoin Season Alert: Trigger when BTC Dominance breaks below 50%
Portfolio Token Alerts: Set key levels for each holding
Volume Alerts: Trigger when 24-hour volume exceeds 300% of average
Step 3: Choose your notification method (email, SMS, or app push)
Trading View Alert Configuration
TradingView's free tier only allows one active alert at a time. If that is what you are working with, make it count.
My priority alert is Bitcoin Dominance at key levels. Here is exactly how to set it up:
Indicator: BTC.D (Bitcoin Dominance)
Condition: Crossing Down
Value: 50%
Options: Once Per Bar Close
Alert Message: Altcoin season signal activated - BTC Dominance broke below 50 percent
You can swap this out for different levels as the market evolves. When dominance is high, alert for breaks below 55%. When it is already low, watch for reversals back above 45%.
My Free Dashboard Stack
You do not need expensive subscriptions to stay informed. Here is my daily monitoring setup using entirely free tools.
What I Monitor | Tool I Use | Why This One |
|---|---|---|
Real-time prices | CoinGecko watchlist | Clean interface, reliable data |
Charts and technicals | TradingView free | Industry standard, community scripts |
On-chain metrics | Fundamental data without cost | |
Market sentiment | Fear & Greed bookmark | Daily ritual check |
Breaking news | CryptoPanic | Aggregates major sources |
Economic calendar | TradingView calendar | FOMC and macro dates |
I spend about 15 minutes each morning checking this dashboard with my coffee. That is usually enough unless alerts fire during the day.
Part 6: Integrated Timing Framework {#part-6-integrated-framework}
Combining Everything for Better Decisions
No single indicator works perfectly on its own. The real edge comes from combining multiple signals into a coherent framework.
I spent years refining this decision matrix. It is not perfect, nothing is, but it has kept me out of the worst trades and in the best ones more often than not.

The Complete Timing Decision Matrix
Fear & Greed Reading | BTC Dominance Trend | FOMC Stance | Overall Signal |
|---|---|---|---|
Extreme Fear | Rising | Hawkish | Wait - not yet time |
Extreme Fear | Stable | Any stance | Accumulate Bitcoin |
Extreme Fear | Falling | Dovish | Strong buy across the board |
Neutral | Falling | Neutral | Accumulate altcoins selectively |
Greed | Falling | Dovish | Hold positions, use trailing stops |
Extreme Greed | Any trend | Hawkish | Take profits aggressively |
Extreme Greed | Rising | Any stance | Exit altcoins immediately |
Sample Monthly Review Process
Consistency beats brilliance. I run through this checklist on the first of every month without fail.
First of Month Checklist:
Check Fear & Greed Index current reading and 30-day trend
Review BTC Dominance level and trend direction
Note Altcoin Season Index reading
Mark FOMC meeting dates for the coming month
Check major token unlock events at TokenUnlocks
Review portfolio allocation against current signals
Set or adjust alerts for the month ahead
Putting It All Together: A Real Example
Let me walk you through how I used this framework in November 2022, which turned out to be one of the best buying opportunities in recent memory.
Fear & Greed Index had crashed to 21 after the FTX collapse. Extreme fear everywhere.
BTC Dominance was stable around 40%, not rising despite the chaos.
FOMC had just signaled they might slow rate hikes. Cautiously dovish.
Every signal pointed to accumulation. I deployed capital I had been sitting on for months. Over the next year, that capital roughly doubled.
Was I scared doing it? Absolutely. The news was terrible. Everyone was calling for 10,000 dollar Bitcoin. But the framework said buy, so I bought.
That is the point of having a system. It takes emotion out of the equation when emotions are running highest.
FAQ Section {#faq-section}
What is the most reliable indicator for timing crypto markets?
Based on my experience tracking these metrics since 2016, the Fear & Greed Index combined with Bitcoin Dominance provides the most consistent signals. Neither works perfectly alone, but together they have called major market turning points with reasonable accuracy. The key is patience. Wait for multiple signals to align rather than acting on any single reading.
How often does altcoin season occur?
Altcoin seasons typically happen once per major market cycle, lasting anywhere from 2 to 4 months at their peak. However, mini-altcoin rotations can occur multiple times during broader bull markets. Since 2017, we have seen three major altcoin seasons (2017 Q4, 2021 Q1, and 2021 Q4) plus several shorter rotation periods. Watch for Bitcoin dominance dropping below 55% as the early warning sign.
Should I sell all my Bitcoin during altcoin season?
No, that would be a mistake in my opinion. Even during the strongest altcoin seasons, I maintain at least 30% Bitcoin allocation. Bitcoin remains the most liquid and least risky crypto asset. The goal is not to abandon Bitcoin, but to increase altcoin exposure at the margins. Selling all your Bitcoin creates unnecessary risk if altcoin season ends abruptly, which it often does.
How do FOMC meetings affect cryptocurrency prices specifically?
FOMC meetings create predictable volatility windows in crypto. Prices often move 3-5% in either direction within 24 hours of major announcements. The direction depends more on surprise versus expectation than on the actual policy decision. Hawkish surprises (tighter policy than expected) tend to hurt crypto. Dovish surprises (looser policy than expected) tend to help. The safest approach is reducing position size before meetings.
What Bitcoin dominance level signals altcoin season is ending?
When Bitcoin dominance bottoms below 40% and begins rising again, that typically signals altcoin season is ending. I start reducing altcoin exposure when dominance drops below 45% and reverses upward. The reversal matters more than the absolute level. A rising dominance from 42% to 45% is a bigger warning sign than stable dominance at 40%.
Can the Fear and Greed Index stay extreme for long periods?
Yes, and this catches many traders off guard. I have seen extreme fear persist for 6-8 weeks during bear market capitulations, and extreme greed last 4-6 weeks during blow-off tops. The indicator tells you sentiment is extreme, not that a reversal is imminent. That is why I combine it with other signals rather than trading it mechanically.
What free tools do you recommend for tracking these indicators?
My core free stack includes Alternative.me for Fear & Greed, TradingView for Bitcoin Dominance charts and price alerts, Blockchain Center for the Altcoin Season Index, and Cryptocurrency Alerting for mobile notifications. You genuinely do not need paid tools for effective timing. The paid services add convenience, not edge.


