
Here’s why Bitcoin price can’t go higher than $87.5K
Bitcoin (BTC) is being capped at $87,500 thanks to manipulation by one or more whales, new analysis says.
The latest market coverage by trading resource Material Indicators on March 20 reveals why BTC/USD is stuck in its current range.
“Spoofy the whale” gets blame for BTC price range
Bitcoin has managed to sustain $80,000 as support for more than a week while hitting two-week highs of $87,500 on March 20.
Despite following broad volatility across risk assets, BTC/USD may have gone even higher were it not for maneuvers of large-volume trading entities on exchange order books.
Looking at global trading platform Binance, Material Indicators argued that shifting blocks of ask liquidity above price were keeping it pinned in a specific area — a classic manipulatory device known as “spoofing,” which has often been used by whales in the past.
“If you are wondering why Bitcoin price hasn’t been able to rally past $87.5k yet, the reason is price suppression from Spoofy the Whale,” it summarized in a post on X.

BTC/USDT order book liquidity data. Source: Material Indicators/X
An accompanying chart shows that the liquidity in question currently sits at $89,000. It also tracks investor order classes, showing all but the largest “whale” transactions distributing.
Discussing the data, Material Indicators hinted that support at the recent multimonth lows of $76,000 was insufficient as a firm market floor.
Bitcoin bulls keep up battle for key trend lines
Meanwhile, popular trader Daan Crypto Trades said that the current low-timeframe area of interest at $84,000 was essential for bulls going forward.
Related: Bitcoin futures ‘deleveraging’ wipes $10B open interest in 2 weeks
“The bulls would want to hold on to the $84K-$85K region to keep the momentum. Otherwise you’re at risk of visiting those lower liquidity clusters which then can end up in a full retrace as price is still choppy,” part of his own X post explained.
“Local market structure is trying to shift to a small uptrend but the bulls need to step in and keep it that way or it will just be a quick deviation/short stop hunt.”
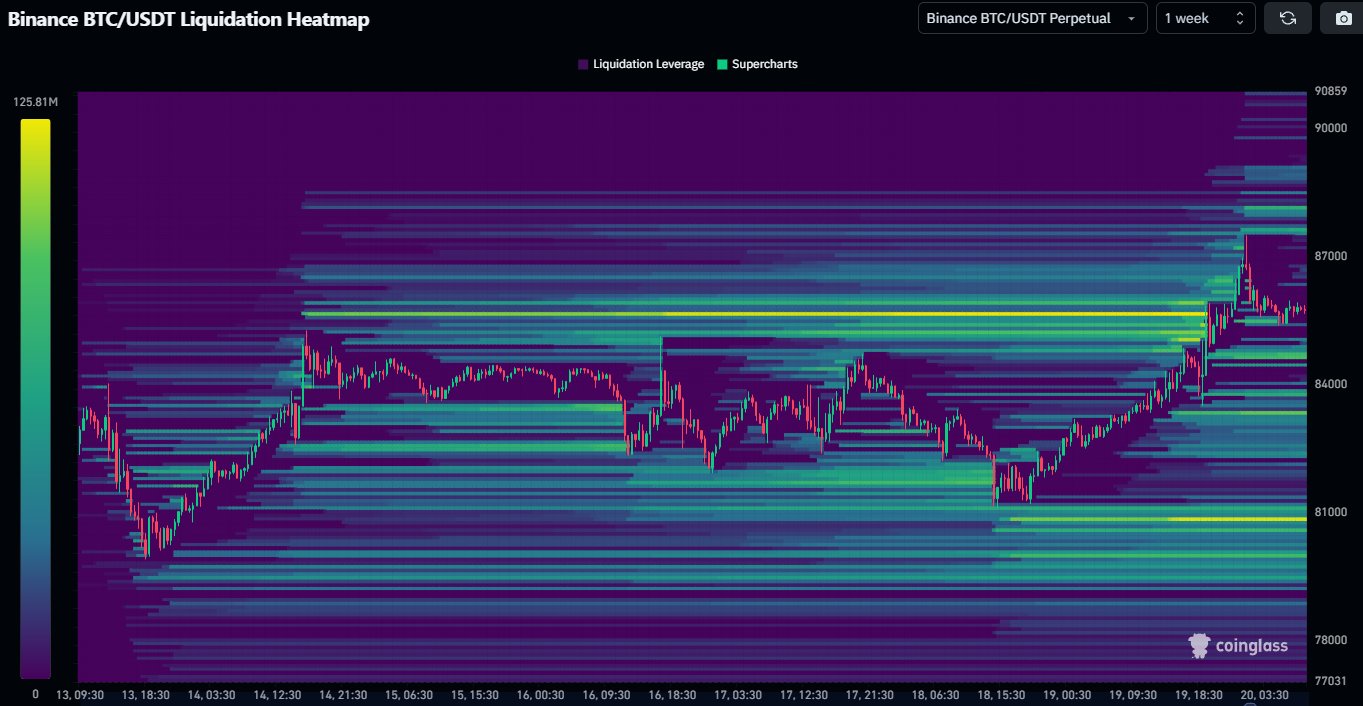
BTC/USDT liquidation heatmap. Source: Daan Crypto Trades/X
Daan Crypto Trades paid additional attention to the 200-day simple moving average (SMA) and exponential moving average (EMA), key bull market trendlines that bulls are currently in the process of trying to flip to support at around $85,000.

BTC/USD 1-day chart. Source: Daan Crypto Trades/X
This article does not contain investment advice or recommendations. Every investment and trading move involves risk, and readers should conduct their own research when making a decision.
 Bitcoin (BTC) $ 123,648.00
 Ethereum (ETH) $ 4,742.66
 XRP (XRP) $ 3.32
 Tether (USDT) $ 1.00
 BNB (BNB) $ 850.33
 Solana (SOL) $ 204.13
 USDC (USDC) $ 0.999820
![]() Lido Staked Ether (STETH) $ 4,728.90
Lido Staked Ether (STETH) $ 4,728.90 Dogecoin (DOGE) $ 0.247555
![]() TRON (TRX) $ 0.363516
TRON (TRX) $ 0.363516 Cardano (ADA) $ 0.950930
 Wrapped stETH (WSTETH) $ 5,736.93
![]() Chainlink (LINK) $ 24.08
Chainlink (LINK) $ 24.08 Hyperliquid (HYPE) $ 47.54
 Wrapped Bitcoin (WBTC) $ 123,493.00
![]() Wrapped Beacon ETH (WBETH) $ 5,095.75
Wrapped Beacon ETH (WBETH) $ 5,095.75 Stellar (XLM) $ 0.463688
 Sui (SUI) $ 4.06
 Wrapped eETH (WEETH) $ 5,083.96
 Bitcoin Cash (BCH) $ 622.41
 Hedera (HBAR) $ 0.269820
 WETH (WETH) $ 4,740.86
 Ethena USDe (USDE) $ 1.00
 Avalanche (AVAX) $ 25.50
 Litecoin (LTC) $ 132.09
 Toncoin (TON) $ 3.56
 LEO Token (LEO) $ 9.25
 Shiba Inu (SHIB) $ 0.000014
 USDS (USDS) $ 0.999416
![]() Uniswap (UNI) $ 12.13
Uniswap (UNI) $ 12.13 Coinbase Wrapped BTC (CBBTC) $ 123,624.00
 WhiteBIT Coin (WBT) $ 46.92
 Binance Bridged USDT (BNB Smart Chain) (BSC-USD) $ 1.00
 Polkadot (DOT) $ 4.32
 OKB (OKB) $ 108.44
![]() Bitget Token (BGB) $ 4.87
Bitget Token (BGB) $ 4.87 Ethena Staked USDe (SUSDE) $ 1.19
![]() Cronos (CRO) $ 0.167610
Cronos (CRO) $ 0.167610 Pepe (PEPE) $ 0.000012
 Ethena (ENA) $ 0.780121
 Aave (AAVE) $ 331.42
![]() Monero (XMR) $ 250.51
Monero (XMR) $ 250.51![]() Dai (DAI) $ 1.00
Dai (DAI) $ 1.00![]() Mantle (MNT) $ 1.13
Mantle (MNT) $ 1.13 Bittensor (TAO) $ 393.91
 NEAR Protocol (NEAR) $ 3.00
![]() Ethereum Classic (ETC) $ 24.24
Ethereum Classic (ETC) $ 24.24 Aptos (APT) $ 5.07
 Ondo (ONDO) $ 1.08
![]() Internet Computer (ICP) $ 6.02
Internet Computer (ICP) $ 6.02 Pi Network (PI) $ 0.400654
 Jito Staked SOL (JITOSOL) $ 249.51
 Arbitrum (ARB) $ 0.556943
 Binance-Peg WETH (WETH) $ 4,745.63
![]() Kaspa (KAS) $ 0.099742
Kaspa (KAS) $ 0.099742 Algorand (ALGO) $ 0.283197
 BlackRock USD Institutional Digital Liquidity Fund (BUIDL) $ 1.00
 Pudgy Penguins (PENGU) $ 0.037454
 POL (ex-MATIC) (POL) $ 0.258219
 VeChain (VET) $ 0.026709
 Cosmos Hub (ATOM) $ 4.88
 Rocket Pool ETH (RETH) $ 5,383.88
 USD1 (USD1) $ 1.00
 Render (RENDER) $ 4.16
 Gate (GT) $ 17.82
 Bonk (BONK) $ 0.000028
 Binance Staked SOL (BNSOL) $ 217.00
 Worldcoin (WLD) $ 1.12
![]() Kelp DAO Restaked ETH (RSETH) $ 4,972.04
Kelp DAO Restaked ETH (RSETH) $ 4,972.04![]() Sei (SEI) $ 0.357546
Sei (SEI) $ 0.357546 sUSDS (SUSDS) $ 1.06
 Fasttoken (FTN) $ 4.58
 Artificial Superintelligence Alliance (FET) $ 0.754252
 Official Trump (TRUMP) $ 9.69
 Jupiter Perpetuals Liquidity Provider Token (JLP) $ 5.45
 Filecoin (FIL) $ 2.74
 StakeWise Staked ETH (OSETH) $ 4,985.52
 Story (IP) $ 5.87
 Sky (SKY) $ 0.082271
 Liquid Staked ETH (LSETH) $ 5,138.70
 Jupiter (JUP) $ 0.559192
 Mantle Staked Ether (METH) $ 5,037.10
 Flare (FLR) $ 0.023463
![]() Lombard Staked BTC (LBTC) $ 123,525.00
Lombard Staked BTC (LBTC) $ 123,525.00 KuCoin (KCS) $ 12.85
 SPX6900 (SPX) $ 1.73
 Injective (INJ) $ 16.03
 Optimism (OP) $ 0.850763
 Celestia (TIA) $ 1.99
 USDtb (USDTB) $ 0.999843
![]() XDC Network (XDC) $ 0.089369
XDC Network (XDC) $ 0.089369 Curve DAO (CRV) $ 1.04
![]() Renzo Restaked ETH (EZETH) $ 4,995.93
Renzo Restaked ETH (EZETH) $ 4,995.93![]() Stacks (STX) $ 0.798756
Stacks (STX) $ 0.798756 Pump.fun (PUMP) $ 0.003920
 NEXO (NEXO) $ 1.37
 USDT0 (USDT0) $ 1.00
 Lido DAO (LDO) $ 1.50
 Falcon USD (USDF) $ 0.999880
 Kinetiq Staked HYPE (KHYPE) $ 47.70


